

National Year-over-Year (YoY) HPA in June was 5.0% and is projected to remain around 4.5% in July and August 2024
/EIN News/ -- WASHINGTON, July 24, 2024 (GLOBE NEWSWIRE) -- National constant-quality home prices in June 2024 were up 0.1% from a month ago and 5.0% from a year ago (not seasonally adjusted), according to data from the American Enterprise Institute’s (AEI) Housing Center. Despite subdued purchase activity and relatively high rates, YoY HPA remains strong, largely due to buyers being well-qualified and continued competition due to a strong sellers’ market. HPA is projected to remain around 4.5% in July and August 2024.
The AEI Housing Center provides the most advanced and timely information on home prices available. For example, the Case Shiller home price index, which will come out later this month, will be an average of March, April, and May 2024, thus effectively reflecting April’s HPA. The AEI Housing Center’s July release is for June, two full months later. Additionally, we use Optimal Blue rate lock data to project July and August 2024’s home price appreciation.
June YoY HPA varied significantly among the 60 largest metros (see #1 in graphic). It ranged from -4.5% in Austin (-7.5% inflation-adjusted) to 10.6% in Providence (+7.6% inflation-adjusted). Austin is down 11.8% from its peak in April 2022.
As of June 2024, metros with historically moderate HPA growth are now appreciating the fastest, while the former high-performers are experiencing the opposite (see #2 in graphic). Beginning in March 2023, metros in the Midwest have now led the national HPA growth for 16 consecutive months.
Historically, the low price tier HPA has outpaced those in the upper price tiers. This trend continued in June, with the YoY HPA up 6.4% and 4.1% for the low price tier and high price tier, respectively.
Months’ supply remained unchanged at 3.2 months in June 2024 compared to May 2024, however up from 2.5 months a year ago, but below 3.4 months in June 2019 (pre-pandemic) (see #3 in graphic). While housing inventory increased by 22% from a year ago, it is still 22% below June 2019, the “last normal” month prior to the pandemic. Meanwhile, existing home sales were relatively flat. On a combined basis, these two factors led to a 0.7 month increase in months’ supply from a year ago. At 3.2 months, June’s months’ supply is still below the nominal price equilibrium or neutral point of 6-8 months, indicative of a continuing strong seller’s market. This helps explain the relatively robust 5.0% YoY price growth in June 2024.
National Home Price Appreciation (HPA) Index – June 2024
Media Contact Details:
Sissi Li
American Enterprise Institute Housing Center
Washington, DC
https://www.aei.org/centers/housing-center/
Sissi.Li@aei.org
203-419-5240
A photo accompanying this announcement is available at https://www.globenewswire.com/NewsRoom/AttachmentNg/1c05ebfb-4e85-4ffd-a642-bf2b37518087

![]()
Home Price Appreciation (HPA) Index - June 2024
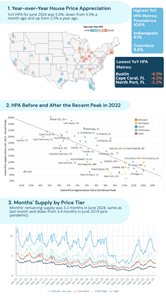
(1) Map of Year-over-Year House Price Appreciation. (2) HPA Before and After the Recent Peak in 2022. (3) Months' supply by price tier.
EIN Presswire does not exercise editorial control over third-party content provided, uploaded, published, or distributed by users of EIN Presswire. We are a distributor, not a publisher, of 3rd party content. Such content may contain the views, opinions, statements, offers, and other material of the respective users, suppliers, participants, or authors.