

ECB staff macroeconomic projections for the euro area, September 2024
Incoming data suggest a weakening in the prospects for euro area growth, but a consumption-led recovery remains the central scenario. Growth recovered in the first half of 2024 amid a boost from net trade. The latest indicators suggest growth will continue in the short run but at rates lower than expected in the June 2024 Eurosystem staff projections. Real disposable income should continue to increase, supported by robust wage growth. This, together with gradually increasing confidence, would underpin a consumption-driven recovery. However, the impulse from consumption is somewhat weaker than foreseen in the June projections, with incoming data and recent surveys pointing to still subdued consumer confidence and elevated household saving intentions. Recent data on business investment also suggest weaker growth momentum. Domestic demand will nevertheless be supported by past monetary policy tightening effects wearing off and an assumed continued easing of financing conditions, in line with market expectations of the future path of interest rates. In addition, a projected rise in foreign demand supports the outlook for euro area exports. The labour market is seen as remaining resilient, with the unemployment rate expected to stay at historically low levels. As some of the cyclical factors that have lowered productivity growth in the recent past unwind, productivity is expected to pick up over the projection horizon. Overall, annual average real GDP growth is expected to be 0.8% in 2024 and to reach 1.3% in 2025 and 1.5% in 2026. Compared with the June projections, the outlook for GDP growth has been revised marginally down for each year of the projection horizon.[1]
Following its recent moderation, headline inflation is projected to increase somewhat in the last quarter of this year, before declining further to the inflation target by the end of 2025. The expected increase in the near term largely reflects energy base effects. Over the medium term energy inflation should settle at low positive rates given market expectations for energy commodity and wholesale prices and planned climate change-related fiscal measures. Recent quarters have seen food price inflation decline strongly, as pipeline pressures have been easing due to lower energy and food commodity prices. Food price inflation is expected to move broadly sideways before moderating further from the end of 2025 onwards. HICP inflation excluding energy and food (HICPX) is expected to remain above headline inflation for almost all of the projection horizon, but to continue its disinflationary path. Services inflation has remained stubbornly high over recent months. However, a gradual decline is still expected later in the horizon, with wage growth and other cost pressures easing, while the lagged impact of past monetary policy tightening continues to feed through to consumer prices. In recent quarters nominal wage growth has started to decline from elevated levels and by more than previously projected. A further gradual easing of wage growth is expected over the coming years as upward impacts from inflation compensation pressures in a tight labour market continue to fade. A recovery in productivity growth should support the moderation in labour cost pressures. Moreover, profit growth has declined notably and will partially buffer the pass-through of labour costs to prices, especially in the near term. Overall, annual average headline HICP inflation is expected to decrease from 5.4% in 2023 to 2.5% in 2024, 2.2% in 2025 and 1.9% in 2026. Compared with the June 2024 staff projections, the outlook for HICP inflation remains unchanged. HICPX inflation surprised slightly on the upside in recent months, leading to small upward revisions in 2024 and 2025.
Table 1
Growth and inflation projections for the euro area
(annual percentage changes, revisions in percentage points)
September 2024 |
Revisions vs June 2024 |
||||||||
|---|---|---|---|---|---|---|---|---|---|
2023 |
2024 |
2025 |
2026 |
2023 |
2024 |
2025 |
2026 |
||
Real GDP |
0.5 |
0.8 |
1.3 |
1.5 |
-0.1 |
-0.1 |
-0.1 |
-0.1 |
|
HICP |
5.4 |
2.5 |
2.2 |
1.9 |
0.0 |
0.0 |
0.0 |
0.0 |
|
HICP excluding energy and food |
4.9 |
2.9 |
2.3 |
2.0 |
0.0 |
0.1 |
0.1 |
0.0 |
|
Notes: Real GDP figures refer to annual averages of seasonally and working day-adjusted data. Historical data may differ from the latest Eurostat publications owing to data releases after the cut-off date for the projections. Revisions are calculated from rounded figures. Data are available for downloading, also at quarterly frequency, from the Macroeconomic Projection Database on the ECB’s website.
Near-term global growth momentum remains positive on the whole, but headwinds to growth have intensified.[2] Global growth excluding the euro area was slightly lower in the second quarter of this year than in the first, but broadly in line with the June 2024 staff projections. While growth is projected to remain stable in the third quarter, incoming data suggest a slowing in the manufacturing cycle amid still restrictive monetary policies. At the same time, surveys suggest steady growth in global services activity. These signals, coupled with heightened geopolitical tensions and recent volatility in financial markets, suggest that headwinds to growth in the near term have intensified.
Over the medium term, global growth is projected to expand at a moderate pace, broadly unchanged compared with the June projections. After increasing by 3.5% in 2023, global real GDP is projected to grow by 3.4% in 2024 and 2025, and by 3.3% in 2026. It has been revised up slightly in all three years compared with the June projections (Table 2). This reflects somewhat stronger growth in major emerging markets such as China and Russia in 2024, as well as higher growth in the United States and the United Kingdom in 2025 and 2026. The stronger growth in the US economy relates to the positive impact of higher than previously assumed net migration and pledges from both presidential candidates to extend the 2017 tax cuts for lower-income households. The impact of these factors was not included in the June baseline. The current baseline projections for the US economy continue to foresee a soft landing, which is corroborated by a gradually cooling labour market and still solid private consumption. Slightly higher growth in the UK economy reflects a stronger than previously expected increase in the second quarter of this year and a more positive impact of real wages on private consumption over the rest of the projection horizon.
Table 2
(annual percentage changes, revisions in percentage points)
|
September 2024 |
Revisions vs June 2024 |
|||||||
|---|---|---|---|---|---|---|---|---|---|
2023 |
2024 |
2025 |
2026 |
2023 |
2024 |
2025 |
2026 |
||
World real GDP (excluding the euro area) |
3.5 |
3.4 |
3.4 |
3.3 |
0.0 |
0.1 |
0.1 |
0.1 |
|
Global trade (excluding the euro area)1) |
1.0 |
3.1 |
3.4 |
3.3 |
0.0 |
0.5 |
0.1 |
0.0 |
|
Euro area foreign demand2) |
0.6 |
2.5 |
3.4 |
3.3 |
-0.2 |
0.4 |
0.0 |
0.0 |
|
World CPI (excluding the euro area) |
5.0 |
4.2 |
3.3 |
2.8 |
0.0 |
0.0 |
0.0 |
-0.1 |
|
Export prices of competitors in national currency3) |
-1.2 |
2.4 |
2.2 |
2.4 |
0.1 |
0.3 |
-0.6 |
-0.2 |
|
Notes: Revisions are calculated from rounded figures.
1) Calculated as a weighted average of imports.
2) Calculated as a weighted average of imports of euro area trading partners.
3) Calculated as a weighted average of the export deflators of euro area trading partners.
Global trade is projected to recover this year and to grow more in line with global activity over the rest of the projection horizon. Following a period of weak growth dynamics, global trade rebounded at the turn of the year. In the second quarter the frontloading of imports in advanced economies added to this recovery. Monthly trade data indicate that companies restocked for the Christmas season about six weeks earlier than in a typical year, likely reflecting fears of both renewed supply bottlenecks and trade tensions amid rising geopolitical risks. Global trade data remain inherently volatile and such strong growth is not expected to be sustained in the near term as the impact of the frontloading fades away.[3] Euro area foreign demand is projected to increase by 2.5% in 2024, 3.4% in 2025 and 3.3% in 2026. Growth in euro area foreign demand has been revised up for this year owing to stronger past outturns, while over the rest of the projection horizon it remains similar to the June projections.
Inflation at the global level is projected to decline, while growth in euro area competitors’ export prices should be stable over the projection horizon. World headline consumer price index (CPI) inflation is projected to decline from 4.2% in 2024 to 3.3% in 2025 and 2.8% in 2026, on account of the restrictive monetary policy in major economies and the fading impact of past supply shocks. Compared with the June projections, the global inflation profile is little changed. Growth in euro area competitors’ export prices (in national currencies and in annual terms) has turned positive in 2024 as the impact of the past declines in commodity prices and domestic and foreign pipeline pressures has dissipated. This means competitors’ export price growth should remain stable over the projection horizon, broadly in line with its historical average. A downward revision compared with the June projections for 2025 and 2026 reflects somewhat stronger projected export price disinflation in certain major economies, such as the United Kingdom.
Box 1
Technical assumptions
Compared with the June 2024 projections, the main changes to the technical assumptions are lower commodity prices (although some energy prices are higher), a stronger euro and slightly lower interest rates. Oil price assumptions, based on futures prices, have been revised down by around 2% over the horizon. They remain in backwardation, with prices falling by around 12% between 2024 and 2026. In contrast, concerns about geopolitical risks linked to the tensions in the Middle East and the recent Ukrainian incursion into Russian territory have led to higher assumptions for wholesale natural gas prices (up by 17% over the projection horizon). The assumptions for wholesale electricity have also been revised up, especially towards the end of the horizon. The euro is assumed to appreciate slightly (by 1.7% against the US dollar – reflecting mainly expectations of significant interest rate cuts by the Federal Reserve System – and by 0.7% in nominal effective terms). The market expectations for short-term interest rates have been revised down by around 30 basis points for 2025 and 2026. The market expectations for long-term bond yields have also been revised down, albeit to a lesser extent.
Table
|
September 2024 |
Revisions vs June 2024 |
||||||
|---|---|---|---|---|---|---|---|---|
2023 |
2024 |
2025 |
2026 |
2023 |
2024 |
2025 |
2026 |
|
Commodities: |
|
|
|
|
|
|
|
|
Oil price (USD/barrel) |
83.7 |
83.2 |
76.1 |
73.2 |
0.0 |
-0.7 |
-2.4 |
-1.7 |
Natural gas prices (EUR/MWh) |
40.6 |
34.2 |
41.1 |
35.4 |
0.0 |
11.0 |
16.0 |
18.1 |
Wholesale electricity prices (EUR/MWh) |
103.5 |
77.4 |
93.3 |
82.2 |
0.0 |
6.0 |
6.4 |
13.0 |
EU Emissions Trading System allowances (EUR/tonne) |
83.7 |
67.5 |
73.8 |
76.4 |
0.0 |
2.2 |
3.8 |
3.8 |
Non-energy commodity prices, in USD (annual percentage change) |
-12.5 |
7.3 |
1.3 |
2.5 |
0.0 |
-4.1 |
-2.6 |
1.6 |
Exchange rates: |
|
|
|
|
|
|
|
|
USD/EUR exchange rate |
1.08 |
1.09 |
1.10 |
1.10 |
0.0 |
0.8 |
1.7 |
1.7 |
Euro nominal effective exchange rate (EER41) (Q1 1999 = 100) |
121.8 |
124.5 |
125.1 |
125.1 |
0.0 |
0.3 |
0.7 |
0.7 |
Financial assumptions: |
|
|
|
|
|
|
|
|
Three-month EURIBOR (percentage per annum) |
3.4 |
3.6 |
2.5 |
2.2 |
0.0 |
0.0 |
-0.4 |
-0.3 |
Ten-year government bond yields (percentage per annum) |
3.1 |
2.9 |
2.8 |
3.0 |
0.0 |
0.0 |
-0.1 |
-0.1 |
Notes: Revisions are expressed as percentages for levels and as percentage points for growth rates and percentages per annum. Revisions for growth rates and interest rates are calculated using figures rounded to one decimal place, while revisions reported as percentage changes are calculated on unrounded figures. The technical assumptions about commodity prices and euro area interest rates are based on market expectations, with a cut-off date of 16 August 2024. Oil prices refer to Brent crude oil spot and futures prices. Gas prices refer to the Dutch TTF gas spot and futures prices. Electricity prices refer to the average wholesale spot and futures price for the five largest euro area countries. The “synthetic” futures price for EU Emissions Trading System allowances (EUA) is derived as the end-of-month linearly interpolated value of the two nearest European Energy Exchange EUA futures. Monthly EUA futures prices are then averaged to produce an equivalent to annual frequency. The path of commodity prices is implied by futures markets in the ten working days ending on the cut-off date. Bilateral exchange rates are assumed to remain unchanged over the projection horizon at the average levels prevailing on the ten working days ending on the cut-off date. The assumptions for euro area ten-year nominal government bond yields are based on the average of countries’ ten-year bond yields, weighted by annual GDP figures. Where the necessary data exist, the country-specific ten-year nominal government bond yields are defined as the ten-year benchmark bond yields prolonged using the forward par yields derived, on the cut-off date, from the corresponding country-specific yield curves. For the other countries, the country-specific ten-year government bond yields are defined as the ten-year benchmark bond yield prolonged using a constant spread (observed on the cut-off date) over the technical euro area risk-free long-term interest rate assumption.
Following broadly flat and anaemic growth throughout 2023, euro area economic activity started to recover in the first half of 2024 (Chart 1).[4] Growth of 0.3% quarter on quarter in the first quarter of 2024 was matched in the second quarter, according to Eurostat’s flash estimate – although the estimate for the second quarter was subsequently revised down to 0.2% after the finalisation of the September projections. The outcome for the second quarter was below the expectations in the June 2024 projections. This was because of lower than expected private consumption growth and investment, as well as weaker inventories, despite a stronger than expected contribution from net trade. Across sectors, industrial value added likely contracted in the second quarter of 2024, while services value added continued to expand.
Chart 1
(quarter-on-quarter percentage changes, seasonally and working day-adjusted quarterly data)
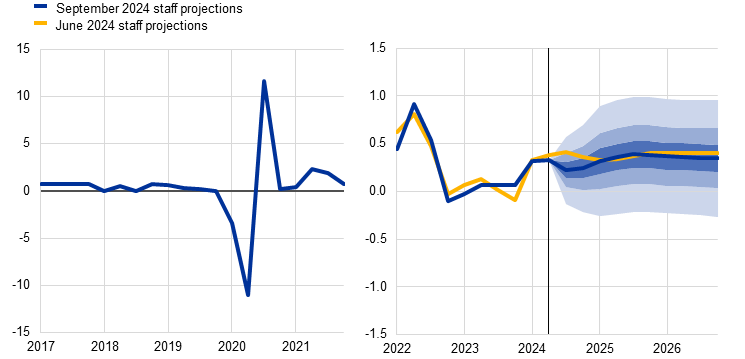
Notes: Historical data may differ from the latest Eurostat publications. The vertical line indicates the start of the current projection horizon. The ranges shown around the central projections provide a measure of the degree of uncertainty and are symmetric by construction. The ranges are based on past projection errors, after adjustment for outliers. The bands, from darkest to lightest, depict the 30%, 60% and 90% probabilities that the outcome of real GDP growth will fall within the respective intervals. For more information, see the box entitled “Illustrating the uncertainty surrounding the projections” in the March 2023 ECB staff macroeconomic projections for the euro area.
Real GDP growth is expected to slow in the second half of 2024 to rates below those foreseen in the June projections. The more subdued outlook reflects the ongoing suppressed level of survey indicators relevant for activity, such as the Purchasing Managers’ Index (PMI) and business and consumer confidence indicators from European Commission surveys. The weakening in the manufacturing sector was particularly pronounced – the manufacturing output PMI for August was 45.8. It mainly related to weak demand, with Germany the country most affected. At the same time, services activity – in part temporarily boosted by the Paris Olympics – seems to be growing at a robust rate, as reflected by the Services PMI indicator standing at 52.9 in August. Overall real GDP is expected to grow by 0.2% in the third and fourth quarters, in both cases 0.2 percentage points below the June projections.
Over the medium term, real GDP is expected to grow at rates similar to historical averages, supported by rising real incomes, strengthening foreign demand and the fading of the dampening effects from monetary policy. The continued growth in real disposable income is expected to support private consumption, which should become the main driver of growth in the second half of 2024, albeit to a lesser extent than envisaged in the June projections. Household spending should also benefit from the resilient labour market, gradually increasing consumer confidence and declining uncertainty, despite currently high saving intentions. Business investment is projected to remain weak in the short term, owing in part to increased political uncertainty. However, a recovery is expected thereafter, reflecting the waning but ongoing drag from past monetary policy tightening and support from both domestic and foreign demand. Export growth is also expected to be boosted by foreign demand. Housing investment is expected to contract in 2024 and 2025 but to recover thereafter, similarly to the profile in the June projections. The normalisation of the inventory cycle is projected to yield a broadly neutral contribution to growth in the second half of 2024, following a significant negative contribution at the turn of the year. Despite an envisaged tightening of the fiscal stance over the projection horizon, government consumption and investment are expected to contribute positively to GDP growth.
Financing conditions, especially high levels of interest rates, are expected to continue to have a strong negative impact on growth, which will fade over the projection horizon. The impact of the monetary policy tightening that took place between December 2021 and September 2023 continues to feed through to the real economy, affecting the growth outlook – particularly for 2024.[5] Following the policy rate cut in June 2024, and on the basis of market expectations for the future path of interest rates at the time of the cut-off date for the projections (Box 1), the negative impact of monetary policy on economic growth is expected to start fading gradually during 2024. While there is considerable uncertainty surrounding the magnitude and timing of this negative impact, it should have largely run its course by 2026.
Compared with the June 2024 projections, real GDP growth has been revised down by 0.1 percentage points in each year of the projection horizon (Table 3 and Chart 2). Historical real GDP data were revised upwards for the second half of 2023, which implied a higher carry-over into 2024. This was, however, more than offset by downward revisions to quarterly growth rates for 2024. At the component level, private consumption and investment have been revised down for 2024. Although net exports have been revised upwards (mainly reflecting data outturns), export growth in the second half of 2024 has been revised down on account of ongoing competitiveness issues. The downward revision for 2025 is solely a result of carry-over effects from the revisions in the second half of 2024. However, for 2026 the change mainly relates to a downward revision to private consumption growth, reflecting a somewhat weaker than foreseen recovery in consumption, and some downward revision to the net trade contribution.
Chart 2
Euro area real GDP growth – decomposition into the main expenditure components
a) September 2024 projections |
b) Revisions vs the June 2024 projections |
|---|---|
(annual percentage changes, percentage point contributions) |
(revisions: percentage points and percentage point contributions) |
 |
 |
Notes: Data are seasonally and working day-adjusted. Historical data may differ from the latest Eurostat publications owing to data releases after the cut-off date for the projections. The vertical line indicates the start of the projection horizon. Revisions are calculated based on unrounded figures. In rounded terns, real GDP growth is revised by −0.1 percentage points in each year of the projection horizon.
Table 3
Real GDP, trade and labour market projections
(annual percentage changes, unless otherwise indicated, revisions in percentage points)
|
September 2024 |
Revisions vs June 2024 |
||||||
|---|---|---|---|---|---|---|---|---|
2023 |
2024 |
2025 |
2026 |
2023 |
2024 |
2025 |
2026 |
|
Real GDP |
0.5 |
0.8 |
1.3 |
1.5 |
-0.1 |
-0.1 |
-0.1 |
-0.1 |
Private consumption |
0.7 |
0.8 |
1.4 |
1.5 |
0.1 |
-0.4 |
-0.3 |
-0.1 |
Government consumption |
1.0 |
1.2 |
1.1 |
1.1 |
0.2 |
0.0 |
0.0 |
0.0 |
Investment |
1.2 |
-0.5 |
1.2 |
2.1 |
-0.1 |
-0.6 |
-0.3 |
0.1 |
Exports1) |
-0.3 |
1.2 |
2.6 |
3.0 |
0.6 |
-0.1 |
-0.3 |
-0.1 |
Imports1) |
-1.1 |
0.0 |
2.8 |
3.3 |
0.3 |
-0.5 |
-0.4 |
0.0 |
Contribution to GDP from: |
|
|
|
|
|
|
|
|
Domestic demand |
0.8 |
0.6 |
1.2 |
1.5 |
0.0 |
-0.3 |
-0.2 |
0.0 |
Net exports |
0.4 |
0.7 |
0.0 |
0.0 |
0.1 |
0.3 |
0.0 |
-0.1 |
Inventory changes |
-0.7 |
-0.4 |
0.1 |
0.0 |
-0.2 |
0.1 |
0.1 |
0.0 |
Real disposable income |
1.1 |
2.8 |
0.8 |
0.8 |
-0.1 |
0.9 |
-0.3 |
-0.4 |
Household saving ratio |
13.4 |
14.9 |
14.5 |
14.0 |
-1.1 |
-0.1 |
0.0 |
-0.2 |
Current account (% of GDP) |
1.5 |
2.6 |
2.7 |
2.7 |
-0.1 |
-0.2 |
-0.2 |
-0.2 |
Employment2) |
1.4 |
0.8 |
0.4 |
0.4 |
0.0 |
0.0 |
0.0 |
-0.1 |
Unemployment rate |
6.5 |
6.5 |
6.5 |
6.5 |
0.0 |
0.0 |
0.0 |
0.2 |
Notes: Real GDP and components refer to seasonally and working day-adjusted data. Historical data may differ from the latest Eurostat publications owing to data releases after the cut-off date for the projections. Revisions are calculated from rounded data. Data are available for downloading, also at quarterly frequency, from the Macroeconomic Projection Database on the ECB’s website.
1) Imports and exports include intra-euro area trade.
2) The employment figures refer to the number of persons employed.
Despite its recent weakness, private consumption is still expected to be the main driver of medium-term growth, supported by robust labour compensation growth, on the back of rising wages and falling inflation. Private consumption growth disappointed in the first half of 2024, as stronger than expected non-labour income contributed to a higher than expected increase in savings compared with the June projections. Household spending growth should strengthen, however, from an annual rate of around 0.8% in 2023-24 to around 1.5% in 2025-26, markedly above the pre-pandemic average of 1.2%. This recovery is driven by rising real disposable income, owing mainly to strong wage growth and robust, albeit moderating, non-labour income (in particular, income from self-employment and financial assets). In the medium term real income growth is projected to moderate as the catch-up in real wages dissipates. At the same time, private consumption growth should benefit from an assumed reduction in uncertainty in 2025-26, supporting a decline in the saving ratio as consumer spending behaviour gradually normalises. Compared with the June 2024 projections, private consumption growth has been revised down by 0.4 percentage points for 2024. This reflects lower than expected dynamics for the first two quarters and a slower rebound thereafter, which also carries over into 2025. This results in a 0.3 percentage point downward revision for 2025, also reflecting the impact of slightly more moderate growth in real disposable income and an expected slower normalisation of households’ spending behaviour. This slower normalisation is also the main factor behind the 0.1 percentage point downward revision for 2026. These revisions are in line with survey data from the European Commission on consumer saving expectations over the next 12 months, which have continued to show an increase over recent quarters.
Housing investment is projected to decline further during 2024, before slowly recovering in the course of 2025 as the negative effects of the tightening of financing conditions gradually ease and household real incomes continue to rise. Housing investment is likely to have continued its prolonged decline in the second quarter, reflecting a persistent weakness in housing demand, exacerbated by the expiration of a significant fiscal incentive in Italy. Housing investment is projected to recover only as of the second half of 2025, on the back of an expected slight decline in mortgage lending rates and rising household incomes. Overall, a further significant fall is expected in 2024, with a negative carry-over to annual growth in 2025. Subsequently, housing investment is projected to increase on an annual basis in 2026 – for the first time since 2022.
Business investment is projected to grow at a moderate but increasing pace over the projection horizon amid improving demand, a fading negative impact from financing conditions and rising green and digital investment. Although elevated policy uncertainty is expected to dampen investment somewhat in the near term, investment is projected to increase gradually, in line with expectations for strengthening domestic and foreign demand and better profit conditions. In 2026 the recovery will be supported by the fading drag from tight financing conditions, as well as by crowding-in effects from the deployment of the Next Generation EU (NGEU) programme and private funds to spur green and digital investment. In this context, firms’ external financing growth is projected to increase gradually over the projection horizon. This stems from the expected strengthening of economic activity, the projected decline in bank lending rates, lower excess cash balances and improved corporate balance sheets.
After a strong rebound in the first quarter of 2024, euro area export growth is expected to dip before picking up modestly to rates that are subdued by historical standards. The rebound in the first quarter was largely driven by services exports, partly on account of volatile Irish data. However, abstracting from the latter, in the second quarter total export growth is estimated to have slowed, reflecting the negative signal from the latest survey indicators for manufacturing and services export orders.[6] The short-term outlook for exports has worsened because of the slight appreciation of the euro and ongoing competitiveness issues – compounded by somewhat higher gas prices – despite a minor upward revision in foreign demand. Indeed, factors weighing on euro area competitiveness, such as the energy shock and issues related to price and non-price competitiveness, continue to remain a drag on euro area exports. Consequently, only at the start of 2025 is a gradual recovery in export growth foreseen – albeit at rates below historical averages. Imports are also expected to grow at a subdued rate in the short term, following a negative surprise in data for domestic investment. Subsequently, they are projected to grow at rates somewhat below their long-term rate. On the whole, after a positive contribution in the first half of 2024, net trade is expected to have a broadly neutral contribution to growth over the projection horizon (Chart 2). It has been revised up for 2024, owing to past data revisions, but is broadly unrevised thereafter.
The labour market is set to remain resilient, although employment growth should slow down in comparison with recent years. Employment grew by 0.2% in the second quarter of 2024, surprising slightly to the upside. It is projected to expand at a rather subdued quarterly growth rate of 0.1% over the projection horizon. In annual terms, employment growth is expected to decline from 1.4% in 2023 to 0.8% in 2024 and to stabilise at 0.4% in 2025 and 2026. This includes a slight downward revision of 0.1 percentage points for 2026, compared with the previous projections. The pattern in employment (Chart 3) reflects the assumption that cyclical factors that have supported employment more than usual in the recent past – such as significant labour shortages, high profit growth, weak real wages and robust labour force growth – will gradually fade away.[7]
Chart 3
(index, 2022 = 100)
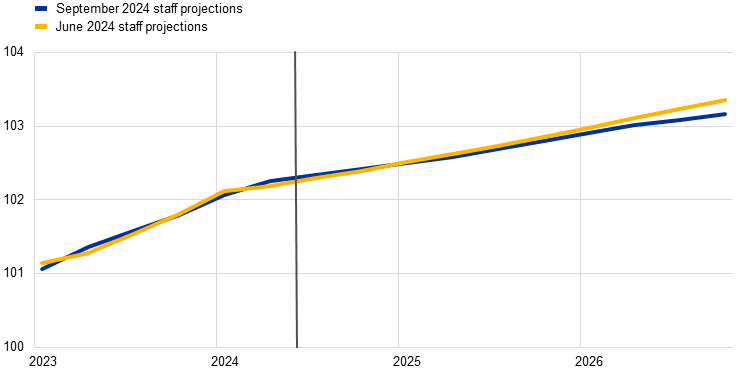
Note: The vertical line indicates the start of the projection horizon.
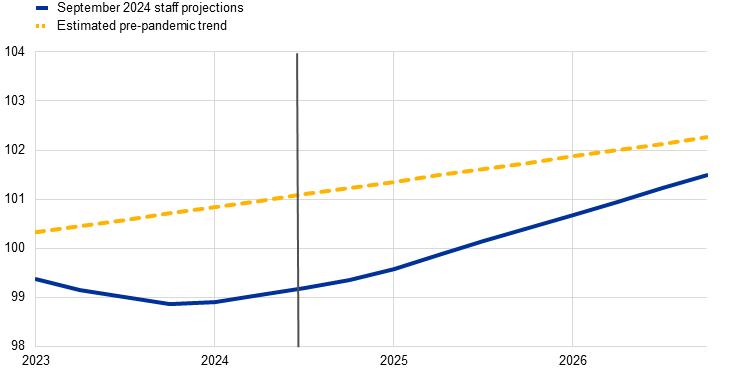
Labour productivity growth is expected to strengthen over the projection horizon. With the cyclical adjustment of the economy over the projection horizon and a slowdown in the previously strong employment growth, productivity is expected to pick up. Nevertheless, productivity growth (per person employed) surprised on the downside in the second quarter of 2024. It has been revised downwards in the second half 2024, reflecting a slower cyclical recovery compared with the previous projections. Productivity growth of 0.9% in 2025 and 1.1% in 2026 is relatively strong – nearly double the historical average of 0.6% per year over the period 2000-19. However, this should be seen against the stagnant annual average productivity growth of 0.3% between 2020 and 2023, leading to a significant negative gap between the trend and actual level of productivity (Chart 4). The cyclical factors that, in the recent past, have supported employment growth, are projected to fade gradually, leading to a cyclical rebound in productivity growth. Nevertheless, structural factors might limit the pace of productivity growth in 2025 and 2026. These include the gradual reallocation of economic activity towards the services sector, the cost of the green transition, a longer-lasting adverse impact of the energy price shock, a slower than expected adoption of highly innovative AI technologies and demographic change, driven by population ageing and the retirement of some baby-boom cohorts.
Chart 4
Labour productivity per person employed
a) Labour productivity level
(index, 2022 = 100)
b) Labour productivity growth rate
(annual percentage changes)
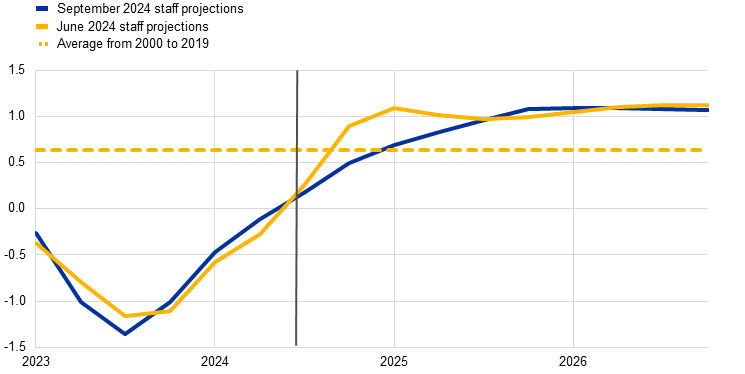
Notes: The vertical lines indicate the start of the projection horizon. Historical averages and estimated pre-COVID-19 trends were obtained using data from 2000 to 2019.
The unemployment rate is expected to remain relatively stable (Chart 5). It is seen as averaging 6.5% in each year of the projection horizon. The path of the unemployment rate is broadly unchanged since the June projections, but it has been revised upwards slightly – by 0.2 percentage points – for 2026, partly on account of less strong employment growth in that year and the slightly weaker growth outlook.
Chart 5
(percentage of labour force)
Note: The vertical line indicates the start of the projection horizon.
The euro area fiscal stance is estimated to tighten over the projection horizon, particularly in 2024, but less than in the June 2024 projections (Table 4). After a slight upward revision for 2023, the fiscal stance is estimated to tighten significantly in 2024, mainly on account of the withdrawal of a large part of the energy and inflation support measures. Although at a much slower pace, the fiscal stance is projected to continue tightening in 2025 and 2026. This is due to a further scaling down of the remaining energy support measures, increases in direct taxes and social security contributions, and slower growth in fiscal transfers. These are partly offset by increases in government consumption and investment. Compared with the June 2024 projections, the euro area fiscal stance and discretionary fiscal policy measures entail less tightening over the period 2024-25. This is on account of lower assumed consolidation in some countries, as well as the extension and/or adoption of fiscal support measures in a few other countries as a result of government-endorsed 2025 draft budgets. At this stage, fiscal assumptions are still surrounded by considerable uncertainty pending the announcement of 2025 budget plans in most euro area countries and the implementation of the revised EU economic governance framework.
Table 4
Fiscal outlook for the euro area
(percentage of GDP; revisions in percentage points)
|
September 2024 |
Revisions vs June 2024 |
||||||
|---|---|---|---|---|---|---|---|---|
2023 |
2024 |
2025 |
2026 |
2023 |
2024 |
2025 |
2026 |
|
Fiscal stance1) |
0.0 |
0.5 |
0.1 |
0.3 |
0.1 |
-0.2 |
-0.2 |
0.0 |
General government budget balance |
-3.6 |
-3.3 |
-3.2 |
-3.0 |
0.0 |
-0.2 |
-0.4 |
-0.4 |
Structural budget balance2) |
-3.7 |
-3.2 |
-3.2 |
-3.0 |
-0.1 |
-0.2 |
-0.5 |
-0.4 |
General government gross debt |
88.2 |
88.5 |
89.3 |
89.8 |
-0.3 |
0.1 |
0.7 |
1.2 |
1) The fiscal policy stance is measured as the change in the cyclically adjusted primary balance net of government support to the financial sector. The figures shown are also adjusted for expected grants under the Next Generation EU (NGEU) programme on the revenue side. A negative (positive) figure implies a loosening (tightening) of the fiscal stance.
2) Calculated as the government balance net of transitory effects of the economic cycle and measures classified under the European System of Central Banks definition as temporary.
While the euro area budget balance is set to improve over the projection horizon, albeit less than in June, the debt ratio is projected to increase. The euro area deficit is projected to decline, falling to the reference value of 3% of GDP in 2026. This is mainly due to a lower cyclically adjusted primary deficit throughout the projection horizon, particularly in 2024, which is seen as outweighing the increase in interest payments. The cyclical component is projected to remain broadly unchanged. Compared with the June projections, the budget balance has been revised down for the whole horizon, mainly reflecting the change in discretionary fiscal policy measures described above and negative composition effects. These effects relate to downward revisions in tax-rich bases, such as compensation of employees and nominal private consumption. The euro area debt-to-GDP ratio is seen to be on an upward path over the projection horizon, as continuous (though declining) primary deficits and positive deficit-debt adjustments more than offset favourable interest rate-growth differentials. Compared with the June projections, the debt ratio has been revised upwards on account of the larger primary deficits and somewhat higher interest rate-growth differentials.
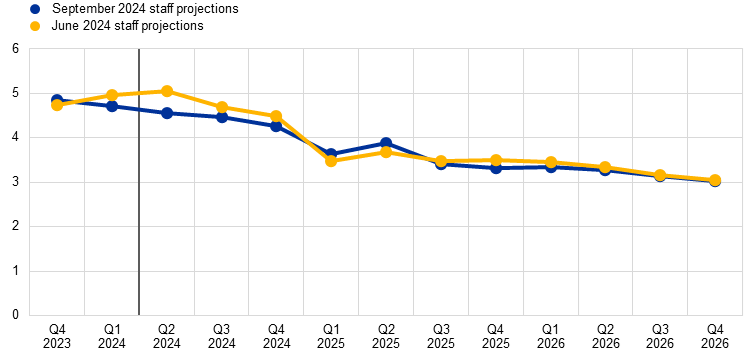
Headline HICP inflation is projected to increase somewhat in the last quarter of 2024, before declining to 2.2% in 2025 and 1.9% in 2026 (Chart 6). Headline HICP inflation is expected to dip in September and to increase again until the end of the year, mainly owing to base effects in energy prices, before returning to a downward path. HICPX inflation is expected to move essentially sideways over the remainder of 2024, at rates of around 3%, before starting to decline in early 2025 driven by the services component. Overall, this implies headline inflation continuing on a slow disinflationary path. It is still expected to reach the 2% inflation target in the fourth quarter of 2025, in line with the June 2024 projections.
Chart 6
(annual percentage changes)
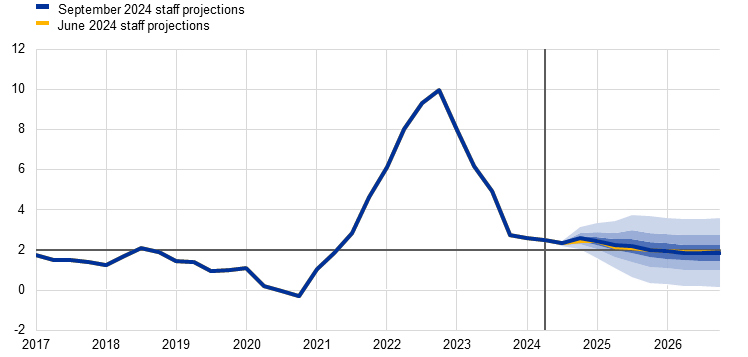
Notes: The vertical line indicates the start of the current projection horizon. The ranges shown around the central projections provide a measure of the degree of uncertainty and are symmetric by construction. They are based on past projection errors, after adjustment for outliers. The bands, from darkest to lightest, depict the 30%, 60% and 90% probabilities that the outcome of HICP inflation will fall within the respective intervals. For more information, see the box entitled “Illustrating the uncertainty surrounding the projections” in the March 2023 ECB staff macroeconomic projections for the euro area.
Following some volatility in the coming quarters, energy inflation is projected to be muted over the medium term. Energy inflation is expected to turn negative again in the third quarter of 2024 and then return to positive territory by the end of 2024, owing mainly to base effects for fuels. Some volatility in energy inflation is also expected in the first half of 2025, including an increase in January associated with the withdrawal of some of the still enacted energy-related fiscal measures[8]. Total fuel inflation is expected to remain negative over the projection horizon owing to the downward-sloping oil price futures curves. This is partly offset by positive gas and electricity inflation, including some upward impacts from climate-related fiscal measures. Overall, energy inflation is expected to be muted and make virtually no contribution to headline HICP in 2025 and 2026 (Chart 7, panel a and Chart 8).
Food inflation is expected to remain broadly unchanged in the near term and subsequently decline moderately on account of moderate developments in input costs (Chart 7, panel b). Food inflation progressively declined to 2.3% in July, owing largely to easing pipeline pressures as the impacts of earlier energy and food commodity price shocks faded. Towards the end of 2024, food inflation is expected increase somewhat. It is expected to move broadly sideways in the first three quarters of 2025, with rates of around 2.5% sustained by inflation in processed food. It is then projected to decline to an average of 2.1% in 2026, partly reflecting the assumption of moderate developments in food commodity prices.
Table 5
Price and cost developments for the euro area
(annual percentage changes, revisions in percentage points)
|
September 2024 |
Revisions vs June 2024 |
||||||
|---|---|---|---|---|---|---|---|---|
2023 |
2024 |
2025 |
2026 |
2023 |
2024 |
2025 |
2026 |
|
HICP |
5.4 |
2.5 |
2.2 |
1.9 |
0.0 |
0.0 |
0.0 |
0.0 |
HICP excluding energy |
6.3 |
2.9 |
2.4 |
2.0 |
0.0 |
0.1 |
0.1 |
-0.1 |
HICP excluding energy and food |
4.9 |
2.9 |
2.3 |
2.0 |
0.0 |
0.1 |
0.1 |
0.0 |
HICP excluding energy, food and changes in indirect taxes |
5.0 |
2.8 |
2.3 |
2.0 |
0.0 |
0.1 |
0.1 |
0.0 |
HICP energy |
-2.0 |
-1.4 |
1.1 |
0.6 |
0.0 |
-0.6 |
0.1 |
0.3 |
HICP food |
10.9 |
2.9 |
2.4 |
2.1 |
0.0 |
-0.1 |
-0.3 |
-0.1 |
GDP deflator |
5.8 |
3.1 |
2.4 |
2.0 |
-0.2 |
-0.2 |
0.0 |
0.0 |
Import deflator |
-2.8 |
-0.4 |
1.7 |
1.8 |
0.1 |
-0.2 |
-0.3 |
-0.1 |
Compensation per employee |
5.3 |
4.5 |
3.6 |
3.2 |
0.1 |
-0.3 |
0.1 |
0.0 |
Productivity per employee |
-0.9 |
0.0 |
0.9 |
1.1 |
0.0 |
-0.1 |
-0.1 |
0.0 |
Unit labour costs |
6.2 |
4.5 |
2.6 |
2.1 |
0.1 |
-0.2 |
0.1 |
0.0 |
Unit profits1) |
5.7 |
0.2 |
1.6 |
1.6 |
-0.5 |
0.1 |
-0.3 |
0.0 |
Notes: Revisions are calculated using rounded figures. The figures for the GDP and import deflators, unit labour costs, compensation per employee and labour productivity refer to seasonally and working day-adjusted data. Historical data may differ from the latest Eurostat publications owing to data releases after the cut-off date for the projections. Data are available for downloading, also at quarterly frequency, from the Macroeconomic Projection Database on the ECB’s website.
1) Unit profits are defined as gross operating surplus and mixed income (adjusted for the income of the self-employed) per unit of real GDP.
Chart 7
Outlook for HICP energy and food inflation
a) HICP energy |
b) HICP food |
|---|---|
(annual percentage changes) |
(annual percentage changes) |
 |
 |
Note: The vertical line indicates the start of the current projection horizon.
Chart 8
Euro area HICP inflation – decomposition into the main components
(annual percentage changes, percentage point contributions)
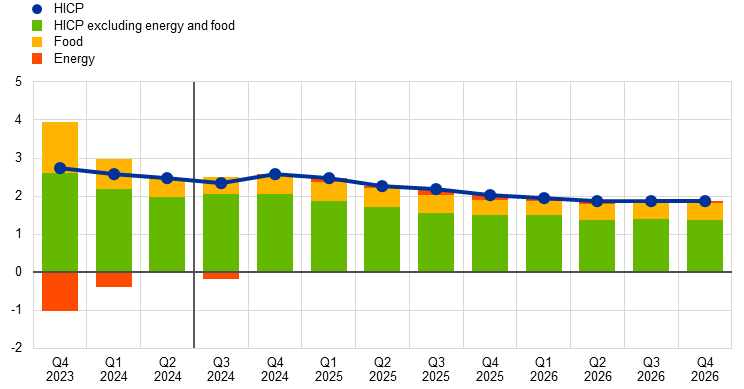
Note: The vertical line indicates the start of the current projection horizon.
HICPX inflation is expected to moderate over the projection horizon, averaging 2.0% in 2026 (Chart 9). The decline in HICPX inflation to the middle of 2024 was mainly driven by moderating growth in the prices of non-energy industrial goods (NEIG). However, NEIG inflation is expected to rise somewhat in late 2024. Services inflation has been more persistent, moving essentially sideways at rates of around 4% in the first half of 2024. It is expected to continue to do so for the remainder of the year. The projected moderation in HICPX inflation in 2025 and 2026 will stem from a gradual decline in services inflation, driven by the unwinding of post-pandemic re-opening effects and the eventual moderation of labour cost pressures, while goods inflation is expected to remain broadly in line with historical averages. More generally, the disinflation process related to HICPX inflation reflects the remaining downward impact from moderating indirect effects of past energy price shocks, as well as the downward impact from monetary policy tightening still feeding through, also via lower wage growth.
Chart 9
Euro area HICP inflation excluding energy and food
(annual percentage changes)
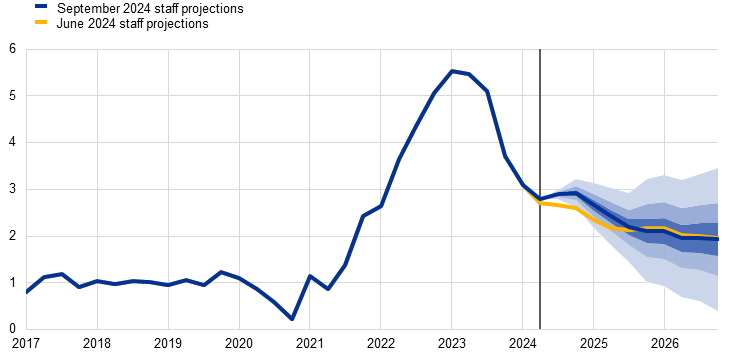
Notes: The vertical line indicates the start of the current projection horizon. The ranges shown around the central projections provide a measure of the degree of uncertainty and are symmetric by construction. They are based on past projection errors, after adjustment for outliers. The bands, from darkest to lightest, depict the 30%, 60% and 90% probabilities that the outcome of HICPX inflation will fall within the respective intervals. For more information, see the box entitled “Illustrating the uncertainty surrounding the projections” in the March 2023 ECB staff macroeconomic projections for the euro area.
Compared with the June 2024 projections, the outlook for headline HICP inflation is unrevised (Chart 10). For 2024 the upward revision to HICPX inflation is offset by a downward revision for energy and food. The upward revision to HICPX inflation in 2024 and 2025 is mostly explained by data surprises in recent months, due to higher outcomes for HICP services inflation. As from the second half of 2025 the quarter-on-quarter profile of HICPX inflation has been revised downwards marginally. This is in line with the downward revision of real GDP and wages, as well as the downward impact from the appreciation of the euro, which is partly offset by indirect effects from higher gas price assumptions. The downward revision to HICP food inflation over the whole horizon is due mainly to lower than expected recent data outturns and lower food commodity price assumptions. Later in the projection horizon, energy inflation is revised upwards in line with an upward revision to wholesale gas and electricity price assumptions (Box 1).
Chart 10
Revisions to the inflation projection compared with the June 2024 projections
(percentage points)
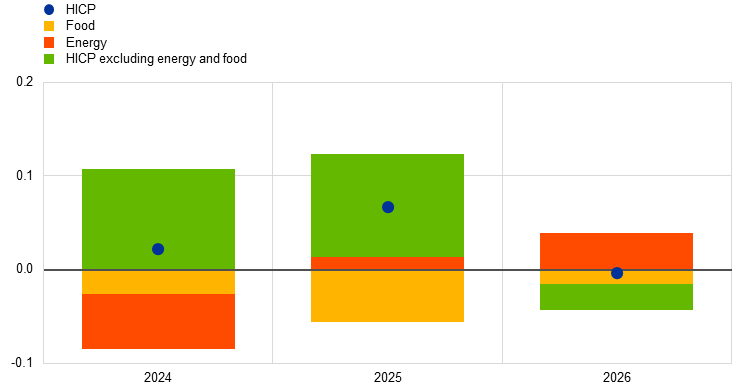
Notes: Revisions are shown based on unrounded data. In rounded terms, HICP inflation is unrevised in each year of the projection horizon.
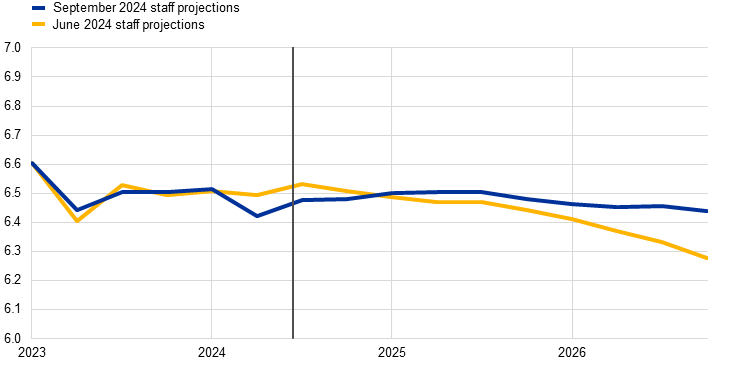
Nominal wage growth is projected to decline gradually but remain elevated, allowing real wages to return quickly to the levels prevailing before the inflation surge (Chart 11). Growth in compensation per employee stood at 4.7% in the first quarter of 2024 and is estimated to have declined further, to 4.6%, in the second quarter (0.5 percentage points below what was expected in the June projections).[9] It is projected to continue to fall in the second half of the year – to average 4.5% over 2024 – and to moderate further over the projection horizon. Nevertheless, it is expected to remain elevated compared with historical levels because of still tight labour markets and remaining inflation compensation. Negotiated wages are expected to increase slightly over the rest of 2024 before a gradual easing thereafter in line with lower inflation. In 2026 growth in compensation per employee is seen at 3.2%, a rate slightly higher than the sum of projected productivity growth and HICP inflation. Compared with the June 2024 projections, growth in compensation per employee has been revised down by 0.3 percentage points for 2024 on account of data surprises in the first half of the year. Real wages are expected to return to early 2022 levels in the third quarter of 2024, in line with the June 2024 projections, and to early 2021 levels soon after that.
Chart 11
(annual percentage changes)
Notes: The vertical line indicates the start of the current projection horizon. Historical data may differ from the latest Eurostat publications (see footnote 9).
Growth in unit labour costs is projected to decline notably. Unit labour cost growth has already come down from its 2023 historical highs to an estimated 4.7% in the second quarter of 2024.[10] It is expected to fall further, and sharply, to 2.1% in 2026. This reflects the projected rise in productivity growth coupled with the decline in wage growth. Nevertheless, unit labour cost growth will remain notably above the pre-pandemic average of 1.5%. Compared with the June 2024 projections, growth in unit labour costs has been revised down by 0.2 percentage points for 2024 and up by 0.1 percentage points for 2025, owing to the revisions in compensation per employee compounded in 2025 by slightly lower productivity growth.
Domestic price pressures, as measured by the growth in the GDP deflator, are projected to continue to decrease, with profit growth first providing a buffer for high labour cost pressures and subsequently recovering (Chart 12). The annual growth rate of the GDP deflator has fallen sharply over recent quarters to 3.2% in the second quarter of 2024.[11] It is projected to continue to decline throughout 2024, averaging 3.1% in 2024 and declining more gradually thereafter to an average of 2.0% in 2026. Unit profit growth peaked at the end of 2022 and turned negative in the second quarter of 2024.[12] It is expected to remain below the rate of growth in unit labour costs throughout 2024, which implies that profit margins are buffering the relatively strong labour cost growth. As growth in unit labour costs moderates and growth in other input costs also remains contained, unit profit growth is expected to recover somewhat as of 2025. This is helped by the economic recovery and strengthening productivity growth. Compared with the June 2024 projections, growth in the GDP deflator has been revised down for 2024 but is unchanged for 2025 and 2026. Unit profits have been revised upwards slightly for 2024 and down by 0.3 percentage points for 2025, buffering the downward revision of unit labour costs in 2024 and the marginal upward revision in 2025.
Chart 12
a) GDP deflator and its components |
b) GDP deflator and its components – revisions vs the June 2024 projections |
|---|---|
(annual percentage changes, percentage point contributions) |
(percentage point contributions) |
 |
 |
Note: The vertical line indicates the start of the current projection horizon.
After a negative annual rate in 2024, import price inflation is expected to remain below 2% in the later years of the projection horizon. Growth in the import deflator is expected to increase from -2.8% in 2023 to -0.4% in 2024, 1.7% in 2025 and 1.8% in 2026. It has been revised down across the horizon in line with revisions to competitors’ export prices and the slight appreciation of the euro implied by the technical assumptions (Box 1).
Alternative energy price paths
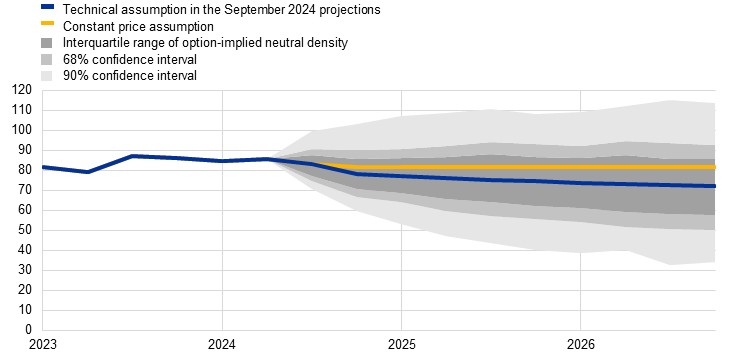
Future energy commodity price developments remain very uncertain and alternative paths for oil and gas commodity prices would have a significant impact on the economic outlook, especially for inflation. While the staff projections are based on the technical assumptions outlined in Box 1, this sensitivity analysis provides alternative downside and upside paths derived from the 25th and 75th percentiles of the option-implied neutral densities for both oil and gas prices.[13] Alternative paths for oil prices are symmetrically distributed around the baseline, reflecting broadly balanced risks. By contrast, the gas price distribution indicates upside risks to the technical assumptions (Chart 13). This likely mirrors adverse geopolitical risks, with the escalation in tensions in the Middle East and the incursion of Ukrainian troops into Russian territory. A constant price assumption is also considered for both oil and gas. In each case, a synthetic energy price index (a weighted average of the oil and gas price paths) is computed and the macroeconomic impacts are assessed using ECB and Eurosystem models. The results are shown in Table 6 and suggest generally stronger upside than downside risks to inflation and more limited risks for GDP growth.
Chart 13
Alternative paths for energy price assumptions
a) Oil price assumption
(USD/barrel)
b) Gas price assumption
(EUR/MWh)
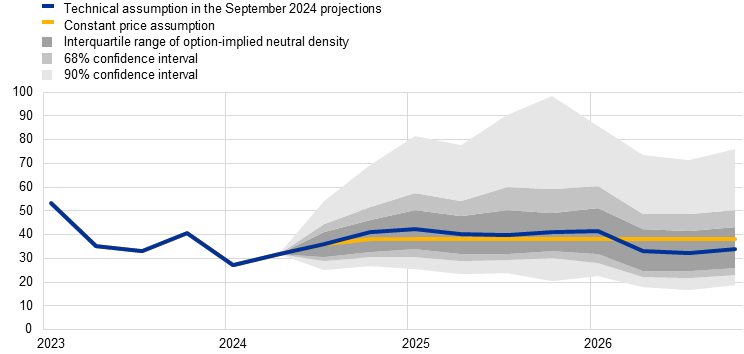
Sources: Morningstar and ECB calculations.
Note: The option-implied densities of gas and oil prices are extracted from 16 August 2024 market quotes for options on ICE Brent crude oil and Dutch TTF natural gas futures with fixed quarterly expiry dates.
Table 6
Alternative energy price paths and their impacts on real GDP growth and HICP inflation
Path 1: 25th percentile |
Path 2: 75th percentile |
Path 3: constant prices |
|||||||
|---|---|---|---|---|---|---|---|---|---|
2024 |
2025 |
2026 |
2024 |
2025 |
2026 |
2024 |
2025 |
2026 |
|
(deviations from baseline levels, percentages) |
|||||||||
Oil prices |
-4.0 |
-14.1 |
-19.1 |
3.6 |
14.8 |
18.5 |
1.2 |
8.1 |
12.3 |
Gas prices |
-10.2 |
-19.8 |
-23.8 |
7.2 |
21.1 |
26.6 |
-2.4 |
-6.9 |
7.9 |
Synthetic energy price index |
-7.3 |
-16.8 |
-20.0 |
6.7 |
19.3 |
24.3 |
0.0 |
2.1 |
10.6 |
(deviations from baseline growth rates, percentage points) |
|||||||||
Real GDP growth |
0.0 |
0.1 |
0.1 |
0.1 |
-0.1 |
-0.1 |
0.0 |
0.0 |
0.0 |
HICP inflation |
-0.2 |
-0.6 |
-0.3 |
0.3 |
0.8 |
0.4 |
0.0 |
0.1 |
0.3 |
Notes: In this sensitivity analysis, a synthetic energy price index that combines oil and gas futures prices is used. The 25th and 75th percentiles refer to the option-implied neutral densities for the oil and gas prices on 16 August 2024. The constant oil and gas prices take the respective value as at the same date. The macroeconomic impacts are reported as averages of a number of ECB and Eurosystem staff macroeconomic models.
Box 2
Alternative scenarios for consumer confidence and the implications for the economy
This scenario analysis explores risks to the September 2024 baseline projection stemming from potential shocks to consumer confidence. The analysis reviews recent developments and assesses, using an empirical model, how unexpected changes in consumer confidence affect households’ decisions on consumption, housing investment and saving. Then, through the lens of the ECB-BASE model, it examines the broader implications for economic activity and inflation resulting from alternative saving and spending decisions triggered by confidence shocks.
Consumer confidence fell sharply at the onset of Russia’s war against Ukraine and has remained subdued ever since, despite some recovery. Since early 2022, euro area consumer confidence has suffered a series of severe economic shocks, including surging energy and overall inflation, vigorous monetary policy tightening and heightened uncertainty. As a result, it hit a trough in September 2022 (Chart A, panel b). Following this initial sharp decline, consumer confidence has recovered in recent quarters but has remained below its pre-war level. Together with the unwinding of the favourable effects from the re-opening of the economy, this persistently subdued level of consumer confidence has held back the exceptionally strong post-pandemic recovery in consumption and housing investment and, conversely, triggered a rise in savings (Chart A, panel a).
Chart A
Private consumption, housing investment, the saving ratio and consumer confidence since 2022
a) Private consumption, housing investment and the saving ratio |
b) Consumer confidence and uncertainty |
(left-hand scale: annual percentage changes; right-hand scale: share of gross disposable income, percentage) |
(standardised level) |
 |
 |
Sources: Eurostat, European Commission Directorate‑General for Economic and Financial Affairs (DG-ECFIN) and ECB staff calculations.
Notes: In panel b), the data are standardised for the entire available sample – from January 1999 to August 2024 for confidence and from April 2019 to July 2024 for uncertainty. The dashed blue line refers to a projection of consumer confidence consistent with the baseline projections through the lens of the empirical model described in Chart B. The alternative paths for consumer confidence as depicted in the chart are described below. In panel b), the vertical line marks the start of the current projection horizon. The latest observations are for the first quarter of 2024 for panel a) and for August 2024 for panel b).
An empirical model indicates that unexpected changes in consumer confidence have significant implications for private consumption, housing investment and the saving ratio. A structural Bayesian vector autoregressive (SBVAR) model is estimated using data for the euro area between the first quarter of 1999 and the fourth quarter of 2019. It incorporates consumer confidence, private consumption, housing investment, the interest rate, real disposable income and the private consumption deflator. The model employs a recursive identification scheme to disentangle the impact of consumer confidence shocks.[14] The impact of a negative one-standard-deviation shock in consumer confidence gives rise to trough declines of around 0.8% in disposable income and 0.6% in private consumption after eight quarters. As a result, it brings about a peak increase of around 0.9 percentage points in the saving ratio after six quarters.[15] Housing investment also falls following the unfavourable confidence shock, with a trough decline of 1.2% after around seven quarters. These findings suggest that a deterioration in consumer confidence weighs persistently on households’ spending and investment while stimulating their propensity to save, also due to precautionary motives.
Chart B
The estimated impact of consumer confidence shocks on real disposable income, private consumption and housing investment
|


Sources: Eurostat, DG-ECFIN and ECB staff calculations.
Notes: The model is estimated on euro area data between the first quarter of 1999 and the fourth quarter of 2019 for consumer confidence, private consumption, housing investment, the interest rate, real disposable income and the private consumption deflator. The interest rate is computed as an average of government short and long-term rates. The variables enter the model in log levels, with the exception of the interest rate. The model is estimated using four lags. A Cholesky identification scheme is assumed with the private consumption deflator ordered first, followed by real disposable income, private consumption, housing investment, interest rates and consumer confidence. The responses shown in the chart are normalised to a one-standard-deviation shock decline in consumer confidence. The blue areas denote the 68% confidence intervals. The effects on the saving ratio are computed based on the model-implied effects of confidence shocks on real disposable income and real private consumption; the implied saving ratio paths are depicted in Chart C.
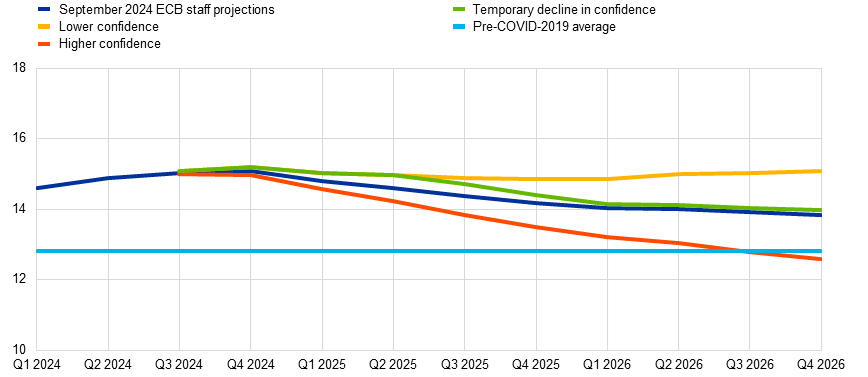
Based on the empirical findings, three alternative paths for the saving ratio and housing investment – reflecting different consumer confidence shocks – are fed into the ECB-BASE model to assess the broad implications for economic activity and inflation.[16],[17] The first (lower confidence) scenario assumes that consumer confidence deteriorates by one standard deviation in the fourth quarter of 2024 and then remains subdued (Chart A, panel b). Such a scenario could be driven by increasing geopolitical uncertainty and more persistent dampening effects of still elevated financing costs. This scenario leads to an increase in the saving ratio above the baseline for precautionary reasons and for the remainder of the horizon. Accordingly, housing investment declines as households adjust their investment decisions to worsening prospects. In contrast, the second (higher confidence) scenario assumes a faster improvement in consumer confidence relative to the baseline, owing to a positive shock of one standard deviation in the fourth quarter of 2024. This scenario could be triggered by more favourable prospects related to slowing inflation, resilient labour markets, the rebound in real incomes and consumer uncertainty receding further. The more favourable consumer confidence translates into a lower saving ratio, which falls to its pre-pandemic level in late 2026, as well as higher spending and housing investment. The third (temporarily lower confidence) scenario assumes that consumer confidence initially declines by one standard deviation in the fourth quarter of 2024 but then rebounds by the same magnitude in the third quarter of 2025. This leads to the saving ratio initially increasing above the baseline before converging gradually with it following the favourable confidence shock in the second half of 2025 (Chart C). The lower confidence scenario leads to real GDP growth being 0.3 and 0.6 percentage points below the baseline in 2025 and 2026, respectively, with real private consumption declining by 0.4 percentage points in 2025 and 0.9 percentage points in 2026 compared with the baseline (Table A). This is accompanied by a negative impact on employment growth of 0.1 percentage points in 2025 and 0.2 percentage points in 2026. HICP inflation would be 0.1 percentage points lower in 2026. The higher confidence scenario implies broadly symmetric positive effects on GDP, consumption and inflation. The temporarily lower confidence scenario implies cumulated deviations in real GDP growth of -0.1 percentage points from the baseline over 2024-26, with larger effects on private consumption, while for inflation the effects are marginal.
Chart C
Alternative paths for the saving ratio
(percentage of disposable income)
Notes: The alternative saving ratio paths are consistent with the implied paths based on the estimated impacts of confidence shocks on real disposable income and private consumption as depicted in Chart B. These alternative paths are fed into the ECB-BASE model, alongside the model-based estimated impacts of confidence shocks on housing investment. The light blue line in the chart represents the average saving ratio in 2019.
The currently still subdued consumer confidence is likely to weigh on households’ spending, investment and saving decisions in the short term. Nevertheless, in the absence of further adverse shocks, euro area consumer confidence is likely to continue its ongoing gradual recovery. This is being driven by slowing inflation, resilient labour markets, the rebound in real incomes and receding consumer uncertainty. Meanwhile, the dampening effects of still elevated financing costs are likely to persist for some time and temper the pace of the recovery in consumer confidence.
Table A
Effects of consumer confidence shocks on real GDP growth, HICP inflation and private consumption
(percentage point deviation from baseline)
Real GDP growth |
Private consumption growth |
HICP inflation |
||||||||||
|---|---|---|---|---|---|---|---|---|---|---|---|---|
2024 |
2025 |
2026 |
Cumulated |
2024 |
2025 |
2026 |
Cumulated |
2024 |
2025 |
2026 |
Cumulated |
|
Scenario 1: Lower confidence |
0.0 |
-0.3 |
-0.6 |
-0.9 |
0.0 |
-0.4 |
-0.9 |
-1.4 |
0.0 |
0.0 |
-0.1 |
-0.1 |
Scenario 2: Higher confidence |
0.0 |
0.3 |
0.5 |
0.9 |
0.0 |
0.4 |
0.9 |
1.4 |
0.0 |
0.0 |
0.1 |
0.1 |
Scenario 3: Temporarily lower confidence |
0.0 |
-0.3 |
0.1 |
-0.1 |
0.0 |
-0.4 |
0.1 |
-0.3 |
0.0 |
0.0 |
0.0 |
0.0 |
Sources: The ECB-BASE model and ECB staff calculations.
Notes: ECB-BASE simulation using the “projection update modality” with exogenous exchange rate and monetary and fiscal policies. Additionally, other channels that could amplify the effects of consumer confidence shocks, such as a corresponding international environment scenario or direct effects through expectations, are excluded. Scenario 1, “Lower confidence”, is constructed by imposing responses of housing investment and the saving ratio consistent with a positive one-standard-deviation shock to consumer confidence as in Chart B, while Scenario 2, “Higher confidence”, imposes the paths consistent with a negative one-standard-deviation shock. Scenario 3, “Temporarily lower confidence”, imposes the responses of housing investment and the saving ratio consistent with a negative one-standard-deviation shock followed by a positive shock of the same magnitude after four quarters. The response of private consumption is consistent with the ECB-BASE-implied response. All numbers are reported in percentage point deviations from the baseline and are rounded to one decimal place.
Box 3
Comparison with forecasts by other institutions and the private sector
The September 2024 ECB staff projections are broadly within the range of other forecasts for GDP and HICP inflation, and slightly above it for core inflation in 2024 and 2025. The staff projection for growth is within a rather narrow range of forecasts by other institutions and surveys of private sector forecasters for 2024 and 2025 but is slightly above the range for 2026. As regards HICP inflation, for 2024 and 2025, the ECB staff projection lies at the top of the range. For 2026, the ECB staff projection is in line with other forecasters at 1.9%. Regarding HICP inflation excluding energy and food, the ECB staff projections are slightly above the range of other forecasters for both 2024 and 2025.
Table
Comparison of recent forecasts for euro area real GDP growth and HICP inflation
(annual percentage changes)
|
Date of release |
GDP growth |
HICP inflation |
HICP inflation excl. energy and food |
||||||
|---|---|---|---|---|---|---|---|---|---|---|
2024 |
2025 |
2026 |
2024 |
2025 |
2026 |
2024 |
2025 |
2026 |
||
ECB staff projections |
September 2024 |
0.8 |
1.3 |
1.5 |
2.5 |
2.2 |
1.9 |
2.9 |
2.3 |
2.0 |
Consensus Economics |
August 2024 |
0.8 |
1.3 |
1.4 |
2.4 |
2.0 |
1.9 |
2.8 |
2.2 |
- |
Survey of Professional Forecasters |
July 2024 |
0.7 |
1.3 |
1.4 |
2.4 |
2.0 |
1.9 |
2.7 |
2.2 |
2.0 |
International Monetary Fund |
July 2024 |
0.9 |
1.5 |
- |
2.4 |
2.1 |
- |
- |
- |
- |
European Commission |
May 2024 |
0.8 |
1.4 |
- |
2.5 |
2.1 |
- |
2.7 |
2.1 |
- |
OECD |
May 2024 |
0.7 |
1.5 |
- |
2.3 |
2.2 |
- |
2.6 |
2.1 |
- |
Sources: Consensus Economics Forecasts, 15 August 2024 (data for 2026 are taken from the July 2024 survey); ECB Survey of Professional Forecasters, 19 July 2024; IMF World Economic Outlook Update, 16 July 2024; European Commission Spring 2024 Economic Forecast, 15 May 2024; OECD Economic Outlook, 2 May 2024.
Notes: These forecasts are not directly comparable with one another or with the ECB staff macroeconomic projections, as the forecasts were finalised at different points in time. Additionally, they use different methods to derive assumptions for fiscal, financial and external variables, including oil, gas and other commodity prices. The ECB staff macroeconomic projections report working day-adjusted annual growth rates for real GDP, whereas the European Commission and the International Monetary Fund report annual growth rates that are not adjusted for the number of working days per annum. Other forecasts do not specify whether they report working day-adjusted or non-working day-adjusted data.
© European Central Bank, 2024
Postal address 60640 Frankfurt am Main, Germany
Telephone +49 69 1344 0
Website www.ecb.europa.eu
All rights reserved. Reproduction for educational and non-commercial purposes is permitted provided that the source is acknowledged.
For specific terminology please refer to the ECB glossary (available in English only).
PDF ISBN 978-92-899-6557-6, ISSN 2529-4466, doi:10.2866/090408, QB-CE-24-002-EN-N
HTML ISBN 978-92-899-6552-1, ISSN 2529-4466, doi:10.2866/694191, QB-CE-24-002-EN-Q
Distribution channels: Banking, Finance & Investment Industry
Legal Disclaimer:
EIN Presswire provides this news content "as is" without warranty of any kind. We do not accept any responsibility or liability for the accuracy, content, images, videos, licenses, completeness, legality, or reliability of the information contained in this article. If you have any complaints or copyright issues related to this article, kindly contact the author above.
Submit your press release