

Euro area economic and financial developments by institutional sector: fourth quarter of 2024
28 April 2025
- Euro area net saving was broadly unchanged at €838 billion in 2024, compared with four quarter period ending on third quarter of 2024
- Household debt-to-income ratio decreased to 82.1% in 2024 from 85.0% one year earlier
- Non-financial corporations' debt-to-GDP ratio (consolidated measure) decreased to 67.2% in 2024 from 68.7% one year earlier
Total euro area economy
Euro area net saving was broadly unchanged at €838 billion (6.9% of euro area net disposable income) in 2024 compared with the four quarter period ending on the third quarter of 2024. Euro area net non-financial investment decreased to €434 billion (3.6% of net disposable income), due to decreased investment by households and non-financial corporations which more than offset increased net investments by financial corporations and general government (see Chart 1).
Euro area net lending to the rest of the world was broadly unchanged at €431 billion reflecting the broadly unchanged net saving and the decrease in net non-financial investment being broadly matched by a decrease in net capital transfers. Net lending of non-financial corporations decreased to €173 billion (1.4% of net disposable income) from €202 billion while that of financial corporations was unchanged at €147 (1.2% of net disposable income). Net lending by households increased to €579 billion (4.8% of net disposable income) from €574 billion. Net borrowing by general government decreased, contributing less negatively to euro area net lending (-€469 billion or ‑3.9% of net disposable income, after -€489 billion).
Chart 1
Euro area saving, investment and net lending to the rest of the world
(EUR billions, four-quarter sums)

* Net saving minus net capital transfers to the rest of the world (equals change in net worth due to transactions).
Financial transactions can be presented with a counterpart sector breakdown for deposits, loans, debt securities, listed shares and investment fund shares (see Table 1). In 2024 the largest aggregated transactions in these financial instruments were interbank operations as other MFIs[1] reduced deposits with the Eurosystem (-€556 billion) while increasing investments with the rest of the world (€513 billion). Financial investment of households involved to a large extent transactions vis-à-vis other MFIs (€361 billion), mostly in the form of deposits, as well as net purchases of investment fund shares (€150 billion). Non-financial corporations’ largest financing component was from within the NFC sector (€117 billion), mostly in the form of loans and often reflecting intra-group transactions, while financing from other MFIs amounted to €102 billion. The financing of general government from the rest of the world, mostly in the form of debt securities, increased (€404 billion).
Table 1
Selected financial transactions* between sectors and with the rest of the world
(EUR billions, four-quarter sums, 2024)
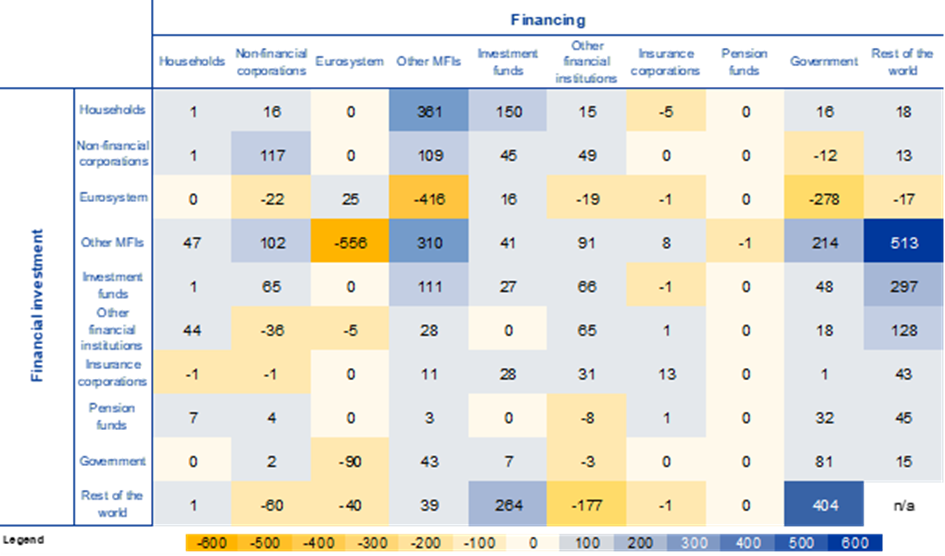
Source: ECB.
* Financial instruments for which the counterpart sector breakdown is available: deposits, loans, debt securities, listed shares and investment fund shares/units.
Households
Household financial investment increased at a broadly unchanged rate of 2.4% in the fourth quarter of 2024. Among its components, investment in currency and deposits (2.9%, after 2.5%) and investment in shares and other equity (1.9%, after 0.7%) grew at higher rates - the latter due to investment fund shares - while investment in debt securities increased at a lower rate (7.7%, after 16.4%).
Households continued to purchase, in net terms, mainly debt securities issued by general government, MFIs, other financial institutions and the rest of the world (i.e. debt securities issued by non-euro area residents). Households were overall net buyers of listed shares, buying listed shares issued by non-financial corporations and the rest of the world, while selling predominantly listed shares of MFIs. Households increased their purchases of euro area investment fund shares, including those issued by MFIs (money market funds) and by non-money market investment funds, and continued to purchase investment fund shares issued by the rest of the world (see Table 2 below and Table 2.2. in the Annex).
Table 2
Financial investment and financing of households, main items
(annual growth rates)
Financial transactions |
|||||
2023 Q4 |
2024 Q1 |
2024 Q2 |
2024 Q3 |
2024 Q4 |
|
Financial investment* |
1.9 |
1.9 |
2.2 |
2.3 |
2.4 |
Currency and deposits |
0.7 |
1.5 |
2.3 |
2.5 |
2.9 |
Debt securities |
55.2 |
39.7 |
28.9 |
16.4 |
7.7 |
Shares and other equity** |
0.1 |
0.0 |
0.2 |
0.7 |
1.9 |
Life insurance |
-0.5 |
-0.0 |
0.3 |
1.0 |
1.2 |
Pension schemes |
2.0 |
2.1 |
2.1 |
2.2 |
2.2 |
Financing*** |
0.8 |
0.9 |
1.2 |
1.4 |
1.8 |
Loans |
0.5 |
0.5 |
0.5 |
0.9 |
1.3 |
Source: ECB.
* Items not shown include: loans granted, prepayments of insurance premiums and reserves for outstanding claims and other accounts receivable.
** Includes investment fund shares.
*** Items not shown include: financial derivatives' net liabilities, pension schemes and other accounts payable.
Chart 2 below shows the stock of selected financial assets held by households (in dark blue) vis-à-vis counterpart sectors, at the end of 2024, and with holdings of investment fund shares/units (14% of households’ financial assets) broken down by underlying asset and counterpart sector.[2] Households’ financial assets were mostly issued by financial intermediaries such as MFIs (42% of households’ financial assets), insurance corporations (23%), pension funds (12%) and the rest of the world (11%). Holdings of financial assets vis-à-vis non-financial corporations (8%), government (3%) and other financial institutions (2%), mainly in the form of listed shares and debt securities, represented much lower proportions of households’ financial assets.
Chart 2
Households’ financial assets by counterpart sector; selected financial instruments*
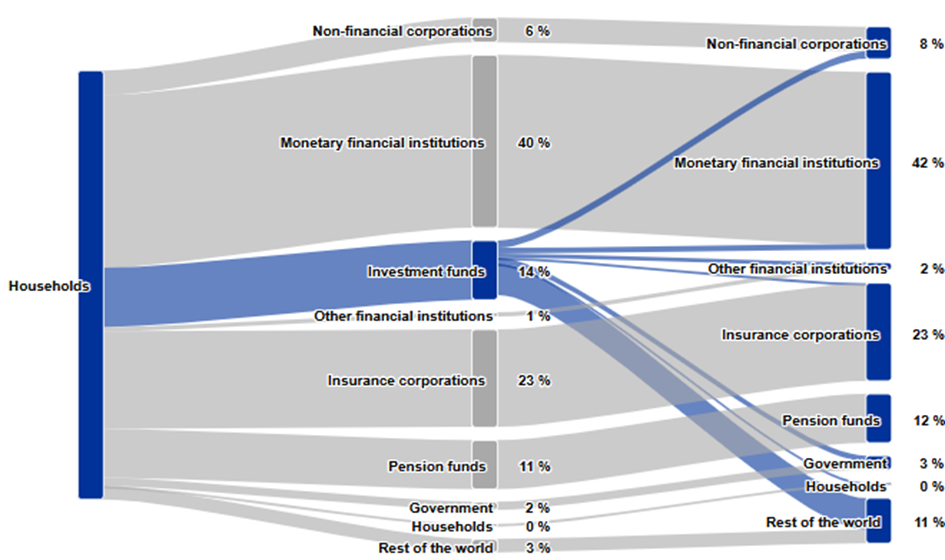
Source: ECB.
Notes: Discrepancies between totals and their components may arise from rounding.
This chart refers to financial instruments for which the counterpart sector breakdown is available: deposits, loans, debt securities, listed shares and investment fund shares/units. In addition, the counterpart sector breakdown for insurance, pension and standardised guarantee schemes (F.6) is an estimate. (See the methodological note on the ECB’s website: Extension of the who-to-whom presentation to insurance and pension assets).
The household debt-to-income ratio[3] decreased to 82.1% in the fourth quarter of 2024 from 85.0% in the fourth quarter of 2023. The household debt-to-GDP ratio declined to 51.5% in the fourth quarter of 2024 from 52.8% in the fourth quarter of 2023 (see Chart 3).
Chart 3
Debt ratios of households and non-financial corporations
(percentages of GDP)
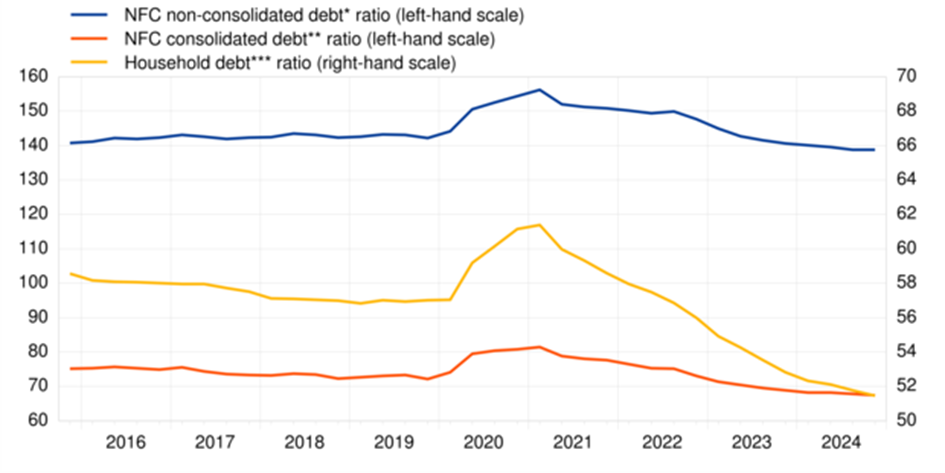
Source: ECB and Eurostat.
* Outstanding amount of loans, debt securities, trade credits and pension scheme liabilities.
** Outstanding amount of loans and debt securities, excluding debt positions between non-financial corporations.
*** Outstanding amount of loan liabilities.
Non-financial corporations
Financing of NFCs increased at a broadly unchanged annual rate of 0.9% in the fourth quarter of 2024, compared to the previous quarter. Net issuance of debt securities grew at a lower rate (1.4% after 2.3%) while financing via trade credits increased at a higher rate (3.9% after 2.8%). Financing via shares and other equity (0.4 after 0.6%) and loans (1.2% after 1.4%) increased at lower rates. Loans granted to NFCs by MFIs increased at a broadly unchanged rate (1.6%), and loans granted by other NFCs grew at an unchanged rate (2.4%). Loans granted by other financial institutions declined at a more negative rate (‑3.5% after -0.6%) mostly due to captive financial institutions (see Table 3 below and Table 3.2 in the Annex).
Non-financial corporations' debt-to-GDP ratio (consolidated measure) decreased to 67.2% in the fourth quarter of 2024, from 68.7% in the fourth quarter of 2023; the non-consolidated, wider debt measure decreased to 138.8% from 140.6% (see Chart 3).
Table 3
Financing and financial investment of non-financial corporations, main items
(annual growth rates)
Financial transactions |
|||||
2023 Q4 |
2024 Q1 |
2024 Q2 |
2024 Q3 |
2024 Q4 |
|
Financing* |
0.8 |
0.9 |
1.0 |
1.0 |
0.9 |
Debt securities |
1.3 |
1.9 |
2.9 |
2.3 |
1.4 |
Loans |
1.6 |
1.5 |
1.3 |
1.4 |
1.2 |
Shares and other equity |
0.3 |
0.4 |
0.7 |
0.6 |
0.4 |
Trade credits and advances |
1.2 |
1.5 |
2.5 |
2.8 |
3.9 |
Financial investment** |
1.6 |
1.8 |
2.0 |
2.1 |
1.8 |
Currency and deposits |
-1.3 |
0.2 |
2.7 |
1.7 |
2.4 |
Debt securities |
19.9 |
8.5 |
5.8 |
1.7 |
-0.1 |
Loans |
4.1 |
3.8 |
3.7 |
3.3 |
2.6 |
Shares and other equity |
0.9 |
1.2 |
1.0 |
1.3 |
0.9 |
Source: ECB.
* Items not shown include: pension schemes, other accounts payable, financial derivatives’ net liabilities and deposits.
** Items not shown include: other accounts receivable and prepayments of insurance premiums and reserves for outstanding claims.
Chart 4 below shows the main components of the non-financial corporations’ debt (in dark blue) vis-à-vis counterpart sectors. At the end of 2024, the non-financial corporations’ debt in the form of loans and debt securities was held primarily by non-financial corporations (36%), MFIs (33%), other financial institutions (11%), and the rest of the world (11%).
Chart 4
The main components of NFC debt (loans and debt securities) by counterpart sector
(2024 end of period stocks)

Source: ECB.
Discrepancies between totals and their components may arise from rounding.
For queries, please use the statistical information request form.
Notes
- These data come from a second release of quarterly euro area sector accounts for the fourth quarter of 2024 by the European Central Bank (ECB) and Eurostat, the statistical office of the European Union. This release incorporates revisions and completed data for all sectors compared with the first quarterly release on "Euro area households and non-financial corporations" of 4 April 2025.
- The euro area and national financial accounts data of non-financial corporations and households are available in an interactive dashboard.
- The debt-to-GDP (or debt-to-income) ratios are calculated as the outstanding amount of debt in the reference quarter divided by the sum of GDP (or income) in the four quarters to the reference quarter. The ratio of non-financial transactions (e.g. savings) as a percentage of income or GDP is calculated as sum of the four quarters to the reference quarter for both numerator and denominator.
- The annual growth rate of non-financial transactions and of outstanding assets and liabilities (stocks) is calculated as the percentage change between the value for a given quarter and that value recorded four quarters earlier. The annual growth rates used for financial transactions refer to the total value of transactions during the year in relation to the outstanding stock a year before.
- Hyperlinks in the main body of the statistical release lead to data that may change with subsequent releases as a result of revisions. Figures shown in annex tables are a snapshot of the data as at the time of the current release.
- The ECB publishes experimental Distributional Wealth Accounts (DWA) for the household sector. The release of results for the fourth quarter of 2024 is planned for 30 May 2025 (tentative date).
Distribution channels: Banking, Finance & Investment Industry
Legal Disclaimer:
EIN Presswire provides this news content "as is" without warranty of any kind. We do not accept any responsibility or liability for the accuracy, content, images, videos, licenses, completeness, legality, or reliability of the information contained in this article. If you have any complaints or copyright issues related to this article, kindly contact the author above.
Submit your press release